Explore a completed spacecraft study
Start with a completed run and follow its evidence from the spacecraft assembly to a design decision. This tour uses the EX14 · Symmetric deployable arrays starter with CAD generation enabled. The pictures show recorded results; opening an existing run does not change its inputs or launch another calculation.
For the first run, follow the Console walkthrough. For the study and its moving panels, see the deployable spacecraft example. Every screenshot below opens at full size. On narrow screens, swipe wide figures horizontally to read their labels.
See the hardware behind the budgets
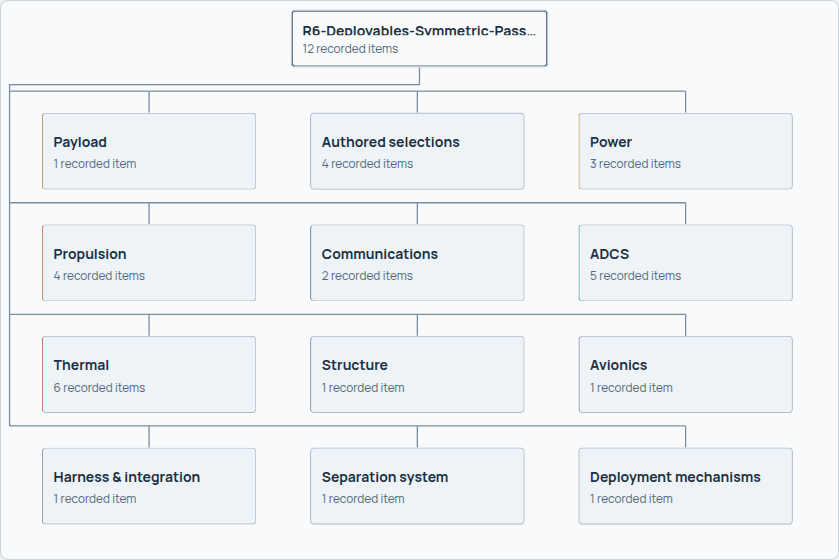
Open Architecture and select Power in the hierarchy. The diagram connects systems to the overall spacecraft; the selected hardware panel connects each system's required capability to the equipment actually recorded in the run.
Now read the selected system's quantities. This study requires 2.707 m² of array area and records 3.25 m² installed across thirteen sections. Required usable battery energy is 209.5 Wh, compared with 326.9 Wh available at end of life. These are sizing comparisons, not a complete electrical qualification.
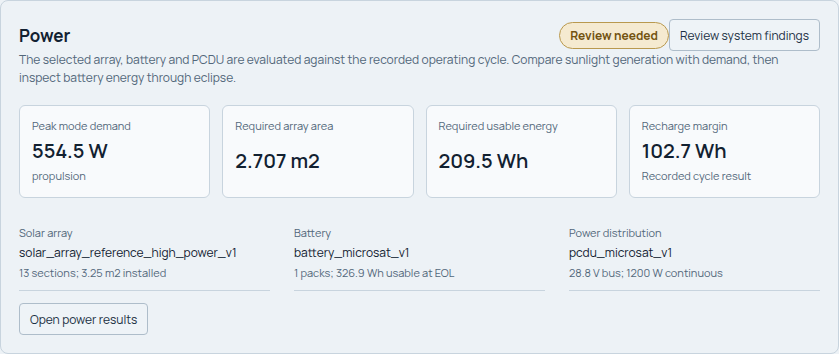
Choose Open power results to inspect the operating modes behind those requirements. In Spacecraft → CAD Inspector, select a physical part to inspect its placement and properties. The geometry guide shows how the assembly, stowed fit, exposed area and deployment path relate.
Work from an analysis plot to its exact quantities
The system workspaces expose different questions. Open the chapter matching the quantity you are investigating; each now includes the actual plot, a selected case or contributor, and a deeper result or source view.
| Investigation | What to inspect in the illustrated guide |
|---|---|
| Where does the mass come from? | Mass cases, Power contribution and CG/inertia |
| Which operating case drives the electrical design? | Sunlight/eclipsed modes, load table and installed hardware |
| What holds a thermal node within its limits? | Temperature bands, signed heat balance and heater/radiator sizing |
| How long does the maneuver plan take? | Delta-v allocation, propellant and active versus elapsed delivery time |
| What changes with a failed wheel? | Nominal and wheel-out authority, governing loads |
| Does the communications result cover data return? | Link margin, path budget and contact assumptions |
| What drives the cost range? | Ranked drivers, recurring/NRE split and line evidence |
| Does the assembly fit its launch envelope? | Numeric accommodation limits and outstanding qualification |
Keep the selected case and units in view. For example, a thermal cold case and hot case are separate steady-state calculations; they are not successive points on an orbital temperature trace. The system guide explains the distinction between successful execution and assessed engineering results.
Read the requirements and result tables
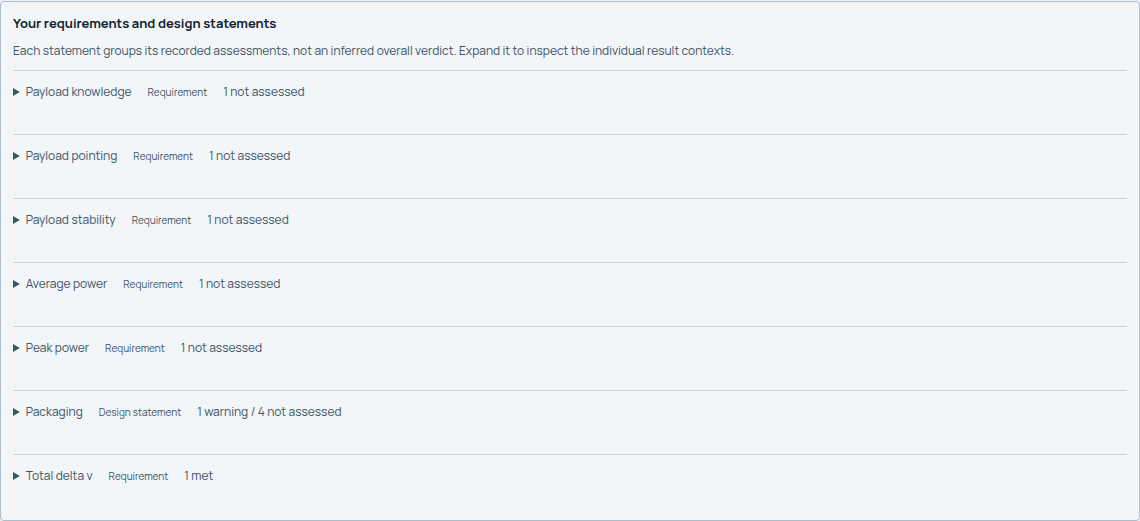
Open Requirements → Your requirements. The compact groups organize the statements authored for the mission without inventing an overall verdict. In this study the total delta-v requirement is met, while several pointing and power requirements remain Not assessed.
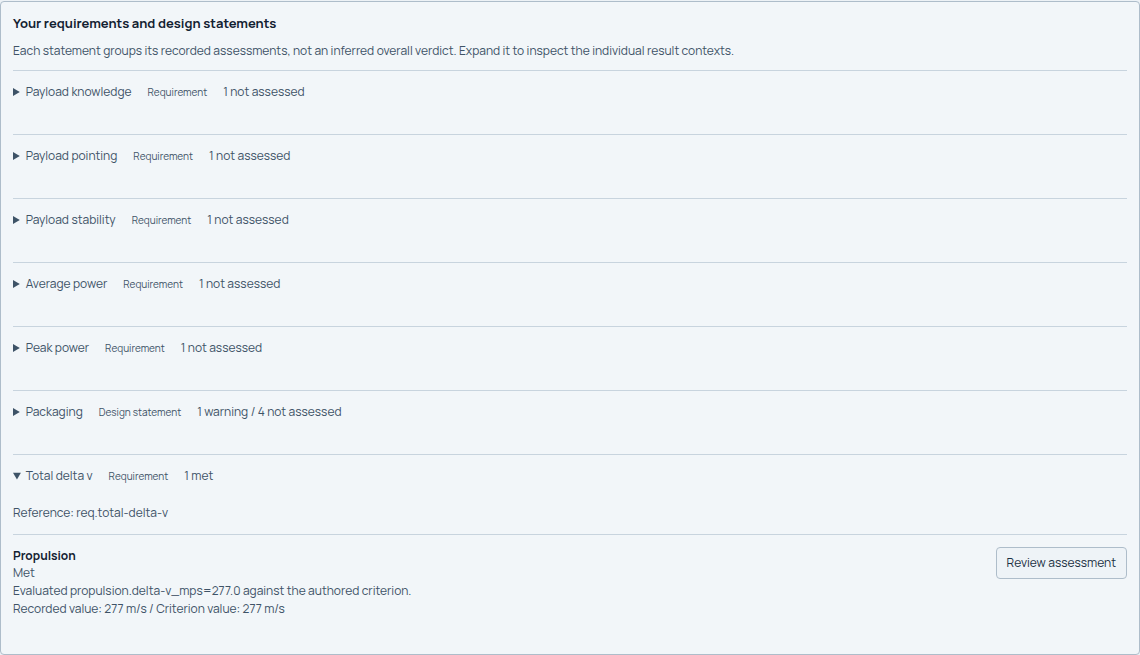
Expand Total delta v to see the requirement's individual recorded assessment and context. A green entry answers that particular question; it does not qualify the other requirement groups.
Switch to Checks, select a Result context, and read the exact table columns. The table distinguishes model applicability, engineering checks and candidate assessments. Sources and context opens the selected row's evidence. The propulsion table below includes recorded checks, values, limits and margins.
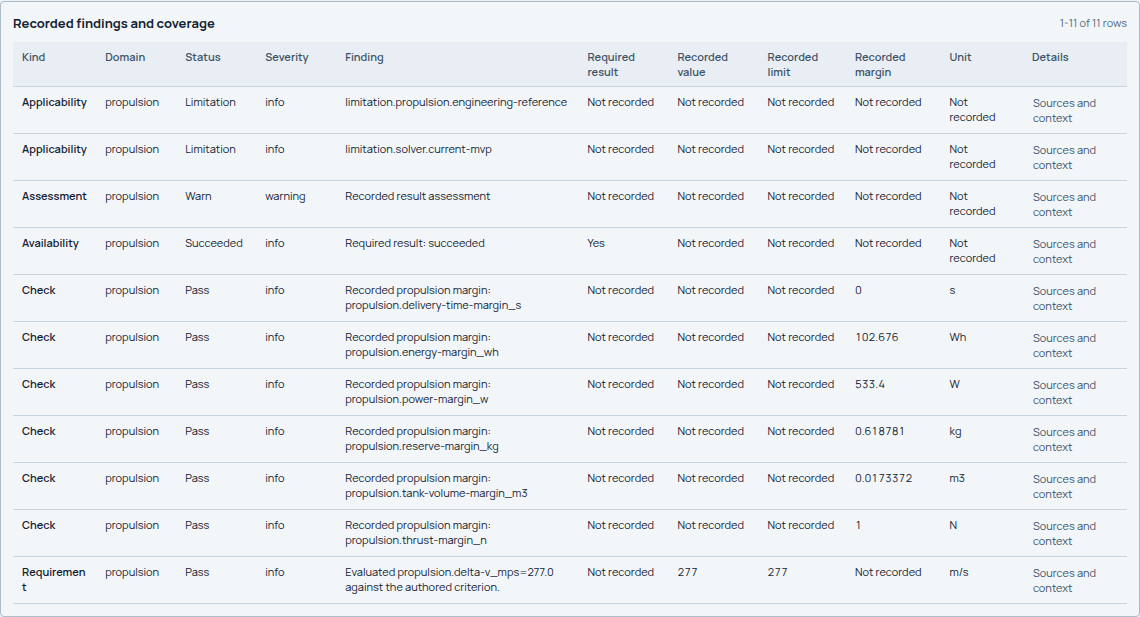
Use Investigate issues to follow a finding through its reason, impact, next action and supporting evidence. A passing check can still deserve inspection when its margin is small or the model has important limitations.
Explain the score before comparing designs
The Evaluation scorecard separates preference score from engineering status. Open a category, then a metric, to see its recorded input, contribution and supporting evidence. Policy explains the weights and caps. The illustrated evaluation guide follows that entire sequence.
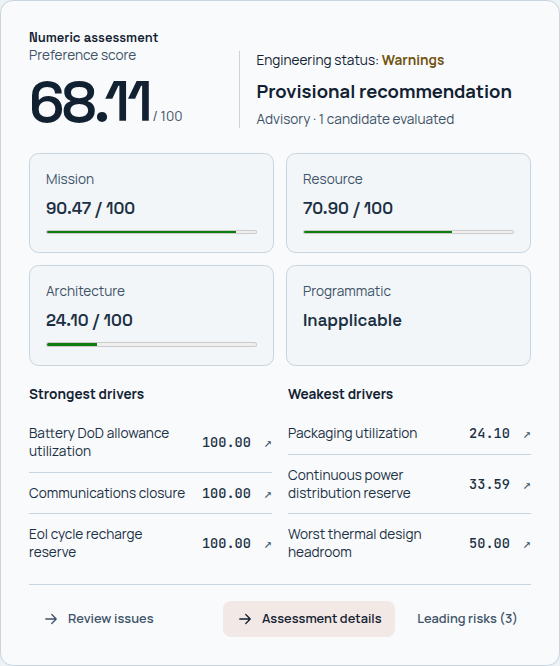
For a controlled alternative, open Compare, choose the designs and inspect Key numbers, Hardware and Checks. A higher preference score alone does not establish that every change is beneficial. The comparison guide shows a real flat-deck versus spine study, including its different installed array quantities and retained source values.
Use the agent as an evidence-reading aid
The Agent panel can explain selected run evidence, cite engineering references and propose input changes. Inspect the references and changed inputs before applying a proposal; applying changes and running a new design are separate operations. An independent review adds a second assessment alongside the saved numeric result.
The agent walkthrough explains citations, proposal validation and changed inputs, plus the two stages of an independent review. Keep these advisory outputs distinct from canonical run results and numerical assessments.